Thursday, May 19, 2011

Mobile phones & driving

Mobile phone use while driving is common, but dangerous. Due to the number of accidents that are related to cell phone use while driving, some rules have made the use of a cell phone while driving illegal. Others have enacted laws to ban handheld mobile phone use, but allow using an earpiece. In some cases restrictions are only directed to minors or those who are newly qualified license holders.
First, I think there is no advantage for using a mobile so the first disadvantage is people will not take care about the other car. For example they can’t see the other cars and may cause accidents. Another disadvantage is they may not see people who walk in the road. Tests by scientists at the Transport Research Laboratory said drivers on mobiles had slower reaction times and stopping times than those under the influence of alcohol. The problem is you actually get sucked into the telephone conversation, and the conversation starts to take precedence over the driving task.
Secondly, the person on the end of the phone doesn't know the driving conditions around you. If someone's in the car talking to you they can stop talking if a dangerous situation arises. People just don't seem to understand how distracting these telephone conversations are.
In conclusion, I think sometimes people have to use mobile, but I think they also should use the headset to take care of the road. In my opinion, people should put a sound message for who’s calling them that they are driving so they will know that they can’t talk.

261 Wards

Thursday, May 12, 2011

5 Underground train system


                This table shows the information about underground train systems in four different countries and five cities, London, Paris, Tokyo, Kyoto and Boston.

          In 1863 the longest underground train system which was 394km was in London and it carried77 million passengers in 2010. Then in 1900 the underground opened in Paris, but it carried more passengers than the first one. The most train passengers is on Tokyo trains which carried 192 million in 2010. The shortest rail was 11km, opened in Kyoto in 1981. In 2001 the Boston train was established and its carries 50 million passengers in 2010 and it rail is 28km.

          In conclusion, we can see that the five trains carry more than 550 passengers and three of them were opened in 20th century. The longest rail is in London and the shortest is Kyoto. Also we can see that Tokyo trains carried the maximum passengers and Kyoto the lowest in 2010.
154 Words

Wednesday, April 27, 2011

Argument of smoking


          In the past smoking was accepted in the public places, but nowadays it is rejected in our society and not allowed all over the world in many public places. So now I’m going to write an essay about smoking.

          The first point I would like to talk about is that the person who smokes is free to spend his money wherever he wants. The second thing is that the government doesn’t prevent smoking and it is allowed not like the drugs. Also some smokers feel relaxed and they release the stress of life when they smoke. Nowadays there are cabins or rooms in most public places that help the smokers to smoke whenever they want.

          Although the smokers are free to do what they do, also non-smokers have their health to consider and the smokers may disturb them. We can see the number of deaths that are caused by smoking is increasing, and it not only affects smokers, it also affects others. So the health authority should issue strict laws about smoking in public places and the media should increase awareness for the teenagers. Also in the schools, the rules should be stricter because the young people are affected easily when they see the older people smoking. A good step would be to ban smoking for drivers if there are children under 12 years old in the vehicle.

          Although the smokers are free when they smoke, also they have to respect the others who don’t smoke. Doctors say smoking is slow suicide and I think it is only a loss of health and money.

264 Wards

Monday, April 25, 2011

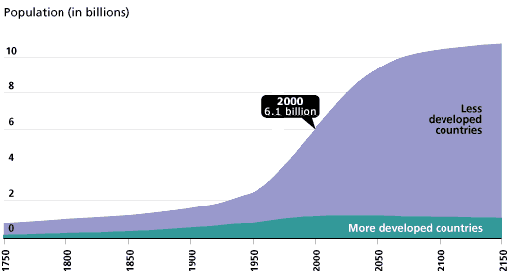
Population growth 1750 - 2150


In this line graph, we can see the population growth in poorer and richer countries from 1750 and 2150. The graph was done by the United Nations World Population Prospects, the 1998 Revision, and estimates by the Population Reference Bureau.

          In 1750 the total world population was about one billion and the population of less developed countries more than the developed countries. It was slightly increasing since 1800 to 1950. From 1950 to 2050 estimated to shot up from 1.5 billion to 7.5 billion in less developed countries, which is not in developed countries. The estimate shows that in 2150 the population will be about 1 billion in more developed countries and in less developed countries will be about 10 billion.

          From the car, they estimate in 2150 the less developed countries will increase about double from now 2011, and it will be stable in more developed countries.

148 Wards

Wednesday, April 13, 2011

Three African cities


The line graph gives information about the average monthly temperatures in three African cities - Mombasa, Cairo, and Cape Town. Each city has its own different climate, with very different characteristics.
The hottest place shown on the graph is Cairo. In July and August, average temperatures rise to over 80º Fahrenheit. However, Cairo also has the biggest variation in climate.Temperatures drop to as low as 55 degrees in Cairo’s winter, during January and February. This is equal to Cape Town’s lowest temperature in July. In fact Cairo and Cape Town are almost opposites in temperature. Cairo is hottest when Cape Town is coldest.
Cape Town does not have the range that Cairo has. Its maximum temperature is 70º F from November to February, after which it drops gradually to about 55 degrees in its winter. In contrast to Cairo or Cape Town,
Mombasa is warm all year round. Its temperature fluctuates very little, ranging from a low of 75 to a maximum of 83 in March.
In conclusion, location is very important in deciding climate. When it is winter in Cairo, it is summer in Cape Town, but Mombasa, being tropical, is warm all year round.


196 words

Thursday, April 7, 2011

Reflection 3


My teacher Hedley told me to write more than 5 essays. The last 3 essays were about hurricanes and tornadoes, cities growth and congestion in Abu Dhabi. One of them should contain four paragraphs, and the other two have three paragraphs. The essay which has 4 paragraphs must contain at least 250 words, and the other two must contain at least 150 words. In the problem/solution conclusion it is important to choose the most viable solution. This is preparation for the argument essays we will do next.
87 words

Wednesday, April 6, 2011

Hurricanes and tornadoes.


The table shows the differences between two very strong winds, hurricanes and tornadoes.

There are many features of the winds. The minimum wind speed for hurricanes is 74 miles per hour, whereas for tornadoes it is 40 miles per hour. However the maximum wind speed for hurricanes is between 155 to 200 miles per hour, whereas tornadoes have got 250 to 300 miles per hour. The hurricane classification scale is the Saffir, Simpson C1to C5, whereas the tornadoes classification scale is the Fujita F0 to F5. Hurricanes can last one week on average, but tornadoes only last a few minutes or sometimes up to a few hours. In addition a hurricane has 300 miles of average width of storm. However tornadoes have 100 to 600 meters and some up to 1.5 km wide. Hurricanes can usually be predicted in advance, whereas tornadoes can’t. Finally, hurricanes start over warm oceans, but tornadoes usually start over land.

Overall, I think that the tornadoes are much more dangerous than hurricanes and the maximum wind also for the tornadoes is higher than for hurricanes.

180 Words

City Growth

This table shows the differences between two very strong winds: hurricanes and tornadoes.

In 1950 there were around 5 million or less in largos Nigeria, Cairo Egypt, Mexico city Mexico, Bombay India and Sao Paolo Brazil and 5 million and above from London England, shanghai china and Tokyo Japan. But in 1970 there were around less than 10 million from London, Cairo, Mexico city, Lagos, Bombay and Sao Polo, more than 10 million of urban from Network, shanghai and Tokyo. In 2000there were fewer than 15 million in London, Cairo, and Lagos and shanghai but a rise to more than 15 million in New York, Mexico City, Bombay, Sao Paolo and Tokyo. In 2015 there will be less than 20 million in London, Cairo and shanghai. Finally the biggest growth is more than 20 million from Lagos, Bombay, Sao Paolo and Tokyo.

In conclusion, I think the city of Lagos has increased more than 22 times; that means the largest increase in population.  

163 Words

Wednesday, March 16, 2011

Congestion in Abu Dhabi


          Thirty years ago there were only a few cars in narrow streets in Abu Dhabi. Nowadays it suffers from traffic congestion, and it is one of the most highly developed cities in the Middle East with the roads bumper to bumper with modern cars. In this essay I will write about the causes and the solutions for these problems.

          There are many things that cause the traffic congestion, and one of them is the growing population. We can see that the number of foreign labourers has increased, and also the number of local people is growing rapidly. Another reason is the construction. In Abu Dhabi there are many repairs and developments in streets which make the drivers drive slowly and also it increases the number of trucks. An additional reason is the young drivers. It is clear that most accidents are caused by them, because of their indifference to regulations and laws.

          These problems can be solved and we can reduce the congestion. The first solution is improving the existing system, this can be done by making bridges and skylines and they have to cancel the traffic light system on the main roads. Another solution is making a limitation of the number of cars per house hold.  We can see that every person in the UAE national family has a car, so this increases the vehicles in the streets. Yet another solution is the staggered hours. They can divide the start time of the works to prevent the rush hour or reduce it.

          Overall, I think most of the solutions are easy to do and it doesn’t need massive effort. There are more solutions that can help the city to reduce the congestion.

283 Words

Sunday, March 6, 2011

Obesity in the UAE


                Across the world, there are many restaurants. In the UAE you can find different kinds of restaurants, and this guides the people who like food to eat more and increase their weight.

          There are many reasons which also could affect the people to increase their weight. For example, few of the UAE nationals are doing exercise or going to the gym for fitness. Another reason is the kind of food they are eating and the quantity of it. An additional problem is the knowledge. The people have do not read and also they weren’t educated when they were young about the dangers of eating food too much and what it can lead to.

          These problems can be solved when there are solutions. One of the solutions is doing lectures in the schools, colleges and university about the danger of being fat. Another solution is building more gyms or some places for walking and doing exercises. Also the people who are obese, should check with doctors monthly or weekly for diets. Another solution is making extra sport classes in schools.

          These are some ideas which can help solve the problem. The person should do exercise whether he is overweight or not, and everyone should have a check up for himself every six months. Otherwise, these problems of obesity can affect their life when they become old, and also can affect the young.

Tuesday, February 22, 2011

Date-producers


          This bar-chart shows us the top ten date-producing countries in 2001. The chart contains 10 countries.

          We can see that Egypt has the highest position in producing dates and it is the only one who makes more than 1 million tonnes. Oman produced about a fifth of Egypt, and Libya produced a quarter of Algeria which produced 350,000 tonnes. Also we can see that Iran produced about 850,000 tonnes and the UAE slightly less than Iran which produced over 800,000 tonnes. Saudi Arabia, Iraq and Pakistan produced more than half a million tonnes each. Sudan produced a quarter of the UAE, about 150,000 tonnes.

          In conclusion, we can see that Egypt produced more than 1 million tonnes and only five countries produced more than 0.5 million tonnes, Iran, UAE, Saudi Arabia, Iraq and Pakistan.

135 Words

Sunday, February 13, 2011

Valentine`s Day Gifts


          These two pie-charts show us the types of gifts and what men buy for women in the USA and vice versa on Valentine`s Day.

          We can see from the charts that the cards take the highest percentage of gifts for women and men; 27% of women which is more than quarter of the total, and for the men shows 18%. Also we can see for the men flowers is the second which is 16%, while the women's second gift is candy, and it shows 21%. 14% of men buy candy and 11% of women buy flowers. 10% of women buy perfume/cologne compared with 4% of men. Jewelry is almost same for both of them, men 10% and women 9%. Also we can see the differences of buying lingerie and spa/personal care. The graphs shows 25% of men buy other gifts and 17% of women.

          In conclusion, we can see there are many types of gifts and there are differences between women and men when they buy gifts.

180 Words

Tuesday, February 8, 2011

The UK budget

          The pie-chart shows the UK government budget and where it was spent in 1996; the total budget is £315 billion.

          They spent about one third on the social security sector which is £100 billion. Health and personal social services had the second highest and it cost £53 billion, and the two of them take more than half of the budget. Also we can see that education spent £38 billion; the chart shows that they spent in debt interest £25 billion which was slightly more than other expenditure sector which spent £23 billion. Defence spent £17 billion followed by law and order which spent £17 billion. From the chart we can see that housing, heritage and environment spent £15 billion and industry, agriculture & employment cost £13 billion.

          It can be clearly seen that the UK government spent a lot of money in their country to improve their social life and as we see from the chart they spent £100 billion. Also the most focus was on health and education which increases the awareness of culture and society.

177 Words